
Graphing Inequalities
When I start working with graphing inequalities with my students, and show the symbol <, there is almost always someone who remembers the inequality alligator who opens his mouth to gobble up the greater number. One of the hardest parts of inequalities is figuring out which way the sign faces in terms of the variable. Does the alligator mouth open towards the x or away from it?
Repeating Keywords
I have to tell my students to read the word problems out loud and think about what they are saying in terms of the variable. Repeating key words and testing them out with possibilities can help them make sure the inequality sign is correct. When we start graphing on a number line, the graph helps to show what the inequality means by helping them visualize the relationship! In order to ensure students can really engage with these inequalities and relate them to concrete representations, I include hand gestures and a game that includes the exciting element of graphing with candies or other snack food.
Set Up for the Lesson: Graphing Inequalities with Cheerios
- Bring in cereal and/or candy to represent the open dots and closed dots. Some ideas are : Cheerios, fruit loops, life savers, kix, pops, m&ms, skittle, raisins, circle candies
- Have cupcake liners or small cups to hold cereal and candy for each group or student
- Provide decks of cards, 1 deck for 2 students
- Provide six sided dice – 1 for every 2 students
- Print out or make blank number lines: 5 on a page
- Insert into plastic sheet protectors
- Provide one to each student along with dry erase markers ( If you don’t have plastic sheets or dry erase, make sure you have enough blank sheets for students to draw multiple inequalities)
- Print out the word chart for the dice. The chart matches each number to various word forms of inequalities
Launch The Lesson
I like to start the class by showing the students the cereal and candy, but I also like to get the students up and moving. To review the notation for graphing inequalities introduce some hand signals that go along with the inequality symbols.
Review the symbols along with the hand signals of an open fist and a closed fist. Like this:
< | Less than | ∘ |  |
> | Greater than | ∘ | 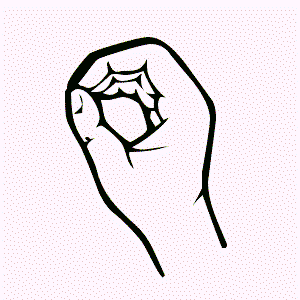 |
≤ | Less than or equal to | ⋅ |  |
≥ | Greater than or equal to | ⋅ | 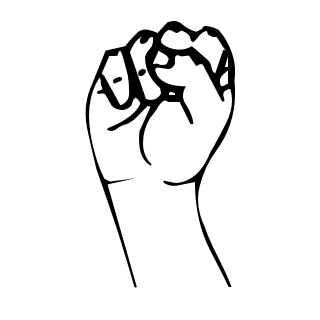 |
Solid Fist vs Circle
Then tell the class that you will say an inequality and they have to put up a solid fist, or make a circle (open dot) with their hand. Explain that they first have to decide whether to hold up a fist for closed dot or an “o” for open dot. They should listen carefully to the word form and determine whether the number is included in the solution or not. Remind them that the closed dot includes the number and the open dot does not. They will hold up their hand signal with one hand, then point in the correct direction with the other arm.
Make sure that all of the students stand up and face you at the board. On the board is a number line for reference. Pointing to the right means to the positive direction and pointing to the left means the negative direction. When you demonstrate, you may want to turn your body to show them how they will point, or if you are facing them, explain that you are their mirror image.
Stand Up!
Have all of the students stand up. Then say some inequalities. Here is a list you can use or adapt: (This should take about 5 minutes)
- Greater than or equal to 5 (closed fist)
- Less than -2 (Open dot)
- Greater than -2 (Open dot)
- More than 8 (open dot)
- Fewer than or equal to 1 (closed dot)
- At least 6 (closed dot)
- At most 12 (closed dot)
- No more than 10 (closed dot)
- No less than -15 (closed dot)
At Least vs At Most
At least and At most can sometimes be tricky. You may have to go over these with a real life situation, like “To ride the roller coaster you must be at least 48 inches tall”
After doing the hand signals, share some real life scenarios for inequalities. Ask “Why do we graph inequalities on a number line? Well, because there is more than one possible solution!” Then share examples of ticket prices. Things like movie tickets and amusement park tickets are good examples. Amusement parks are great because there’s usually an “under 3 is free” policy, as well as prices for children, adults and seniors. Teaching about prices is good to do for the age group of your class because, 6th and 7th graders are usually right at the age when prices change too!
Here’s an Example:
Explain that it’s time to go to the movies and the sign says “Ticket Prices: Children twelve and under $10.00 ; Adults $15.00”
Say something like, “Does that mean you have to be twelve to pay ten dollars?” And usually the students make a resounding “NO!” So then ask “Well what does that mean?” Eventually you should get to the point where anybody age 12, or 11, or 10, anything under 12 or equal to 12 can pay that price.
Then show that if the only answer was 12, then you would have one point, c=12. Draw a closed dot on the number line on the board at 12. Make a closed fist and place it on the board over that solid dot. Then ask, “which other ages pay this price?” After asking the question, slowly start to drag your fist from the dot to the right, then to the left, until you get confirmation that you’re going the correct direction. Sometimes students say things like “11! Or anything less than 12, or… that way, go left!” If you can be dramatic and point and say “This way? Or this way?” you might be able to get the class even more active.
Draw an arrow going from the closed dot, along the number line to the left and explain that the solution includes 12 and all of the numbers less than 12. The line shows all of the possible values. The closed dot (cover it with a closed fist again) indicates that the line includes the number 12.
Draw a new number line underneath. Graph the same arrow, pointing left, but connect it to an open dot on the 12. Open up your fist and show a circle with your hand, just like the hand signals from before. Make your “o” hand encircle the 12 on the board. Ask the students if they could tell what the difference is with this line. You can have students talk with each other in partners so that everyone gets a chance to share ideas with someone. Students start to explain that the line has an open dot or donut, versus a solid dot. Clearly show your open dot hand going around the 12 and ask, “Do you think this graph includes the 12?” Usually students start to realize that it does not.
Graphing Inequalities Activity
Ask your students to get ready to make some graphs with food, and hold up some cheerios or fruit loops and some m&ms or skittles. While holding up the food, ask, “Can you tell what part of the graphs these will be?” If they aren’t sure, you can hold up a single cheerio or fruit loop and look through the hole. And say something like, “is this an open dot or a closed dot?” Do the same with the closed dot type of snack.
Tell your students that they will all get clean cereal and candy at the end of the game, but that they should not eat the snacks used on the number lines.
Graphing Inequalities on a Number Line Activity Rules
Briefly explain the rules for the cards and the dice:
- Deck of cards
- Black suits are positive face value of the card (J=11, Q=12 K=13)
- Red suits are negative face value
- Dice : Use the chart below for each roll (Chart also on worksheet)
| 1 | 2 | 3 | 4 | 5 | 6 |
| Less than | At least | At most | Greater than or equal to | Is no more than | Is no less than |
Rules of the game:
- Draw a card
- Roll the dice.
- Say the inequality out loud
- Graph the inequality on the number line using a cheerio or m&m for the dot
- Then draw an arrow in the correct direction along the number line.
- Test a number included in your solution to see if it fits the inequality
- Write the inequality and the graph on page 2 of the student worksheet
Do an example with the class, such as this one: Black 6 of clubs, roll a 3. Means “at most positive 6”
Put an m&m on the six and draw an arrow to the left
This game should be played in pairs. Partners can take turns drawing cards and rolling the dice. One partner can say the inequality out loud and then they can both try to graph it simultaneously. This may lead to debate or discussion, and they can compare answers.
Reflecting on the Graphing Inequalities Activity
Walk around and help students share and verbalize the inequalities. Ask questions while they play and have them think about creating a real life situation about the phrase or testing a new number. Some examples: “What was the easiest card/roll that you made, why?” “Could you graph it first and then figure out the inequality?” “What could be a real world scenario that would have an inequality with negative numbers?” “What does the variable mean?”
When students finish 5 examples and chart them on page 2, they should answer questions on page 3 of the worksheet. When they have completed and checked page 3 of the worksheet, the students can receive their snacks. They can also erase their graphs and practice some more.
Extensions: Graphing Inequalities on a Number Line
- Glue on the candy/cereal to create a chart or poster for each inequality term that show examples of those inequalities and their graphs.
- Research and find inequalities in real life examples (Ticket prices, menus, advertisements, ect) . Show graphs of each.
- Desmos online graphing activity and practice
FREE Graphing Inequalities 6th Grade Worksheet and Resources
These are all PDF Files. They will open and print easily. The Student Edition Files are labeled SE and the Teacher Editions Files are labeled TE. Click the links below to download the different resources.
- 5-1 Assignment SE – Inequalities
- 5-1 Assignment TE – Inequalities
- 5-1 Bell Work SE – Inequalities
- 5-1 Bell Work TE – Inequalities
- 5-1 Exit Quiz SE – Inequalities
- 5-1 Exit Quiz TE – Inequalities
- 5-1 Guide Notes SE – Inequalities
- 5-1 Guide Notes TE – Inequalities
- 5-1 Interactive Notebook – Inequalities
- 5-1 Lesson Plan – Inequalities
- 5-1 Online Activities – Inequalities
- 5-1 Slide Show – Inequalities
Graphing Inequalities Worksheets and Resources
To get the Editable versions of these files Join us inside the Math Teacher Coach Community! This is where we keep our full curriculum of 4th Grade Math Lessons and Activities.
- 5-1 Assignment SE – Inequalities (Become a Member)
- 5-1 Assignment TE – Inequalities (Become a Member)
- 5-1 Bell Work SE – Inequalities (Become a Member)
- 5-1 Bell Work TE – Inequalities (Become a Member)
- 5-1 Exit Quiz SE – Inequalities (Become a Member)
- 5-1 Exit Quiz TE – Inequalities (Become a Member)
- 5-1 Guide Notes SE – Inequalities (Become a Member)
- 5-1 Guide Notes TE – Inequalities (Become a Member)
- 5-1 Interactive Notebook – Inequalities (Become a Member)
- 5-1 Lesson Plan – Inequalities (Become a Member)
- 5-1 Online Activities – Inequalities (Become a Member)
- 5-1 Slide Show – Inequalities (Become a Member)
Do You Want 6th Grade Math Activities Delivered To Your Inbox Everyday?
If you would like our 4th Grade Math, 5th Grade Math, 6th Grade Math, 7th Grade Math, and 8th Grade Math Resources Emailed to you Daily Click Here.

This Activity is From Unit 1 – Inequalities
- 5-1 Inequalities
- 5-2 Solving One Variable Inequalities
- 5-3 Solutions of Inequalities
- 5-4 Solutions of Inequalities on Number Line
- 5-5 Applications of Inequalities
Don’t Forget to Pin this 6th Grade Math Activity Graphing Inequalities with Cheerios…